Ethereum (ETH) technical analysis today [x]
1 viewers

triducdinh

Member
BHT
2
0 ❤︎ Messages: 85 Tìm chủ đề
25 0

[11/24/2025] In-Depth Analysis of ETH Price Volatility: Multi-Timeframe Outlook (1H – 12H – 1D) and 10 Possible Scenarios in the Next 24 Hours​


Ethereum (ETH) continues to capture attention as the leading altcoin and the backbone of decentralized applications. With the market entering a highly sensitive phase, understanding short-term and mid-term volatility becomes essential for traders. Based on the provided charts across the 1-hour, 12-hour, and 1-day timeframes, this article presents a comprehensive, SEO-optimized analysis of ETH's current price action and outlines 10 possible scenarios that may unfold in the next 24 hours.

Generated Image November 24, 2025 - 10_43PM.jpeg

1. Current Overview of ETH Price Dynamics​


ETH is currently moving in a narrow consolidation zone near its recent local lows. Sellers appear to be losing momentum, yet buyers have not demonstrated strong conviction either. Indicators such as RSI, MACD, and OBV signal a neutral-to-weak bullish attempt, hinting at a potential volatility expansion ahead.

Moving averages across higher timeframes still point downward, confirming that the broader trend remains bearish. However, the recent compression in volatility suggests that a short-term breakout is possible.

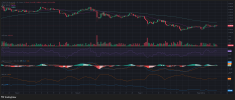
2.1-Hour Timeframe (1H) Analysis​


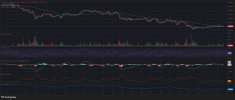
screenshot (5).png


2.1 Trend structure​


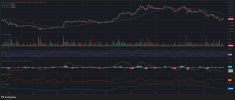
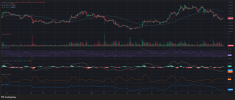
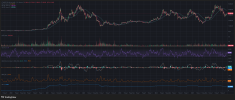
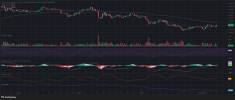
ETH fluctuates around the 2.80–2.85k area.

MA50 and MA99 remain above price → short-term trend still bearish.

Bollinger Bands are tightening, pointing toward an upcoming volatility spike.

2.2 Technical indicators​


RSI near 50 → balanced momentum.

MACD hovers around the zero line → weak trend on both sides.

Volume is declining → traders are waiting for a catalyst.

2.3 Summary​


ETH is in accumulation mode, preparing energy for a possible breakout within the next 24 hours.

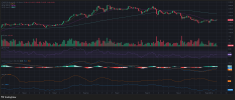
3.12-Hour Timeframe (12H) Analysis​


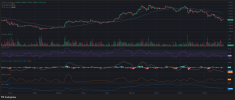
screenshot (4).png

3.1 Trend structure​


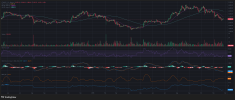
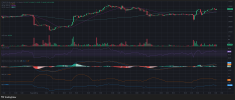
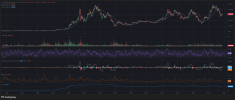
The downtrend from the 4.8k region remains intact.

Price attempts recovery but still struggles beneath MA99.

3.2 Technical indicators​


RSI at~36–40: Near oversold, showing potential for bounce.

MACD declining but losing downward momentum.

OBV slightly negative → capital inflow remains limited.

3.3 Summary​


ETH is situated near a medium-term support area, yet a clear reversal signal has not formed.

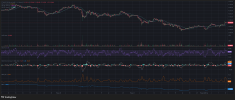
4.1-Day Timeframe (1D) Analysis​


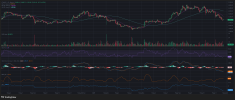
screenshot (3).png


4.1 Trend structure​


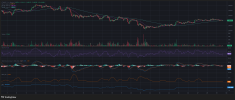
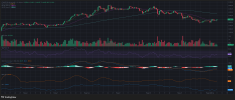
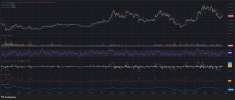
Price is below MA20, MA50, and MA100 → strong downward trend.

Candlestick formations show selling pressure but no panic.

4.2 Technical indicators​


RSI 30–32 → deep oversold, prime for technical rebound.

MACD significantly negative, showing persistent long-term weakness.

Stable volume indicates absence of extreme speculation.

4.3 Summary​


While the long-term trend remains bearish, ETH is entering a major support zone, making relief rallies increasingly likely.

5. Ten Possible ETH Price Scenarios in the Next 24 Hours​


ScenarioDescription & AnalysisProbability
1Sideways movement around 2.80–2.85k; equilibrium between buying and selling pressure; low BBW.30%
2Short-term recovery toward 2.90k due to dip-buying and MA20 retest.20%
3Breakout toward 2.95–3.00k driven by temporary demand increase and reduced exchange supply.10%
4Pullback toward 2.60–2.65k if selling pressure resurfaces.15%
5Sharp drop toward~2.30k if bearish continuation accelerates.5%
6Wide-range volatility due to whale actions or sudden news.8%
7Strong rebound toward~3.20k powered by altcoin market optimism.4%
8Slow, steady grind downward without panic selling.6%
9False breakout to~2.95k followed by rejection.1%
10Unexpected macro/crypto catalyst triggers large unpredictable movement.1%

6. Overall Interpretation for Traders​


Combining all timeframes:

1H → accumulation, prepping for a move

12H → near oversold, rebound possible

1D → major support region, potential for a relief bounce

This alignment suggests that short-term bullish impulses may occur even while the broader trend remains downward.

Follow top professional traders using Binance Copy Trading

Register on Binance to receive a 10 USDT bonus
 
0 ❤︎ Messages: 85 Tìm chủ đề

[November 26, 2025] ETH Price Volatility Analysis – Technical Outlook on the 1H, 12H and 1D Charts With 10 Probable Scenarios


Generated Image November 26, 2025 - 8_29PM.jpeg

1. Ethereum 1-Hour Chart Analysis (1H)


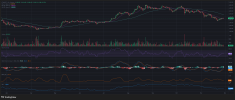
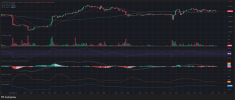
On the 1-hour timeframe, ETH shows compression after an extended downtrend. This indicates a potential volatility expansion ahead.

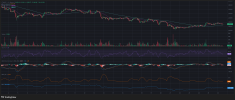
screenshot (5).png

1H Momentum Outlook


RSI (Relative Strength Index) sits in a neutral zone-neither oversold nor overbought-showing indecision among short-term participants.

MACD lines are converging, with histogram momentum declining, suggesting a possible shift in direction or at least a slowdown in downward pressure.

Bollinger Band Width (BBW) is relatively narrow, a classic precursor to a breakout.

1H Price Behavior Summary


ETH is consolidating between 2, 880–2, 920 USD, forming a compression channel. A breakout above 2, 950 may trigger bullish intraday flow, while a breakdown below 2, 880 may accelerate selling momentum.

Short-term traders should monitor volatility expansion signals, especially sudden spikes in volume or wide-body candles.

2. Ethereum 12-Hour Chart Analysis (12H)


The 12-hour chart offers a mid-range perspective, capturing trend direction more reliably than short-term timeframes.

screenshot (4).png

12H Trend Dynamics


ETH is struggling near a prior support region around 2, 880–2, 930, which now acts as a critical inflection zone.

Long-term MAs (e. G, MA 99) remain above the current price, suggesting that bearish macro pressure is still dominant.

RSI (12H) remains below 50, reflecting a bearish/slightly neutral momentum.

MACD (12H) shows weakening bearish momentum with a shrinking negative histogram, hinting at potential accumulation.

12H Price Behavior Summary


The 12H structure suggests ETH is in a mid-term downtrend but entering a consolidation pocket. A reversal may form if ETH can reclaim 3, 000 USD convincingly with strong volume.

3. Ethereum 1-Day Chart Analysis (1D)


The daily chart reflects broader market psychology and directional bias for swing and position traders.

screenshot (3).png

1D Trend Context


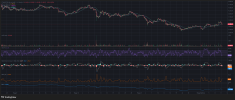
ETH continues forming lower highs and lower lows, a classic bearish structure.

MA 99 and MA 50 are sloping downward, confirming long-term trend weakness.

RSI (D1) remains below 50 without touching oversold levels, indicating no strong reversal signal yet.

MACD (D1) remains in the negative domain with mild bearish momentum.

Volume remains muted, suggesting lack of institutional or whale-driven inflows.

1D Price Behavior Summary


ETH is still within a macro downtrend, but daily candles show decreasing momentum. This opens the door for a relief bounce-though it remains dependent on catalysts such as liquidity inflow, market sentiment shifts, or macroeconomic drivers.

4. Ten Possible ETH Price Scenarios in the Next 24 Hours


Below is the scenario table rewritten in English with clarity and SEO optimization.

ScenarioDescription & AnalysisProbability
1ETH rebounds from the 2, 880–2, 920 zone and moves toward 2, 950–3, 000 due to weakening bearish pressure and tightening MACD on lower timeframes18%
2ETH breaks down below 2, 880 and drops toward 2, 820–2, 850 as the broader 1D trend remains bearish16%
3Price consolidates sideways between 2, 880–2, 950 as volatility remains low and BBW stays compressed on the 1H chart14%
4Minor push to 3, 020, failing near long-term MAs before returning to the 2, 900 region10%
5A sharper decline toward 2, 750 triggered by elevated selling volume aligned with the daily downtrend9%
6ETH breaks above 3, 000 and stabilizes for several hours, signaling a short-term recovery8%
7Quick rally toward 3, 080–3, 120 due to a short squeeze driven by hidden accumulation shown in OBV7%
8Fake breakdown below 2, 880 followed by a swift rebound to 2, 950 (liquidity trap)6%
9Ultra-tight range around 2, 900 ± 20 as the market awaits major catalysts6%
10Highly volatile 2, 850–3, 050 swings driven by low liquidity and algorithmic trading6%

5. What Traders Should Monitor


Volume Spikes


Strong green or red volume bars often precede sudden breakouts or breakdowns.

12H and 1D Candle Closures


A close above 3, 000 USD may shift sentiment bullish.

A close below 2, 880 USD may activate deeper downside targets.

Macro News and Ethereum-Specific Updates


Protocol upgrades, ETF discussions, regulatory announcements, or institutional adoption can heavily shape price momentum.

Whale and Institutional Flow


An uptick in OBV on higher timeframes often signals early accumulation phases.

6. Conclusion


ETH is hovering at a key decision point. Lower timeframes show consolidation that may soon expand into higher volatility. Mid- and long-term charts still lean bearish, but weakening momentum hints that a relief rally is possible if volume steps in.

Traders should stay alert to volatility expansion signals, volume surges, and key price levels such as 2, 880 and 3, 000, which may define ETH's next directional move.

For those who prefer automated trading exposure, you can explore Binance Copy Trading here

Or register a new Binance account and receive a 10 USDT bonus here
 

Users who are viewing this thread

Back