 398
398
 15
15
[11/24/2025] In-Depth Analysis of ETH Price Volatility: Multi-Timeframe Outlook (1H – 12H – 1D) and 10 Possible Scenarios in the Next 24 Hours
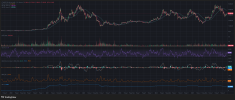
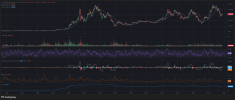
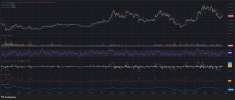
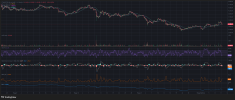
Ethereum (ETH) continues to capture attention as the leading altcoin and the backbone of decentralized applications. With the market entering a highly sensitive phase, understanding short-term and mid-term volatility becomes essential for traders. Based on the provided charts across the 1-hour, 12-hour, and 1-day timeframes, this article presents a comprehensive, SEO-optimized analysis of ETH's current price action and outlines 10 possible scenarios that may unfold in the next 24 hours.

1. Current Overview of ETH Price Dynamics
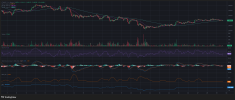
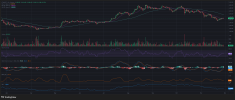
ETH is currently moving in a narrow consolidation zone near its recent local lows. Sellers appear to be losing momentum, yet buyers have not demonstrated strong conviction either. Indicators such as RSI, MACD, and OBV signal a neutral-to-weak bullish attempt, hinting at a potential volatility expansion ahead.
Moving averages across higher timeframes still point downward, confirming that the broader trend remains bearish. However, the recent compression in volatility suggests that a short-term breakout is possible.
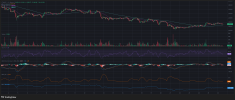
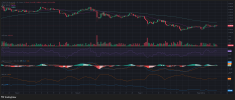
2.1-Hour Timeframe (1H) Analysis
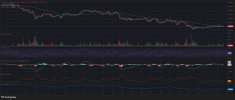
2.1 Trend structure
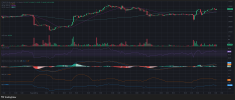
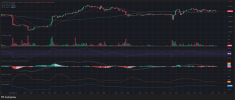
ETH fluctuates around the 2.80–2.85k area.
MA50 and MA99 remain above price → short-term trend still bearish.
Bollinger Bands are tightening, pointing toward an upcoming volatility spike.
2.2 Technical indicators
RSI near 50 → balanced momentum.
MACD hovers around the zero line → weak trend on both sides.
Volume is declining → traders are waiting for a catalyst.
2.3 Summary
ETH is in accumulation mode, preparing energy for a possible breakout within the next 24 hours.
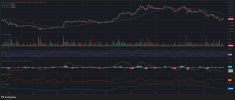
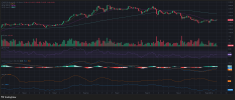
3.12-Hour Timeframe (12H) Analysis

3.1 Trend structure
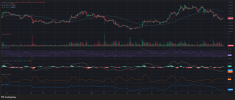
The downtrend from the 4.8k region remains intact.
Price attempts recovery but still struggles beneath MA99.
3.2 Technical indicators
RSI at~36–40: Near oversold, showing potential for bounce.
MACD declining but losing downward momentum.
OBV slightly negative → capital inflow remains limited.
3.3 Summary
ETH is situated near a medium-term support area, yet a clear reversal signal has not formed.
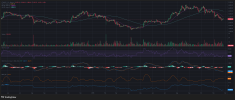
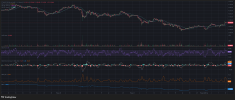
4.1-Day Timeframe (1D) Analysis

4.1 Trend structure
Price is below MA20, MA50, and MA100 → strong downward trend.
Candlestick formations show selling pressure but no panic.
4.2 Technical indicators
RSI 30–32 → deep oversold, prime for technical rebound.
MACD significantly negative, showing persistent long-term weakness.
Stable volume indicates absence of extreme speculation.
4.3 Summary
While the long-term trend remains bearish, ETH is entering a major support zone, making relief rallies increasingly likely.
5. Ten Possible ETH Price Scenarios in the Next 24 Hours
| Scenario | Description & Analysis | Probability |
|---|---|---|
| 1 | Sideways movement around 2.80–2.85k; equilibrium between buying and selling pressure; low BBW. | 30% |
| 2 | Short-term recovery toward 2.90k due to dip-buying and MA20 retest. | 20% |
| 3 | Breakout toward 2.95–3.00k driven by temporary demand increase and reduced exchange supply. | 10% |
| 4 | Pullback toward 2.60–2.65k if selling pressure resurfaces. | 15% |
| 5 | Sharp drop toward~2.30k if bearish continuation accelerates. | 5% |
| 6 | Wide-range volatility due to whale actions or sudden news. | 8% |
| 7 | Strong rebound toward~3.20k powered by altcoin market optimism. | 4% |
| 8 | Slow, steady grind downward without panic selling. | 6% |
| 9 | False breakout to~2.95k followed by rejection. | 1% |
| 10 | Unexpected macro/crypto catalyst triggers large unpredictable movement. | 1% |
6. Overall Interpretation for Traders
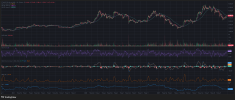
Combining all timeframes:
1H → accumulation, prepping for a move
12H → near oversold, rebound possible
1D → major support region, potential for a relief bounce
This alignment suggests that short-term bullish impulses may occur even while the broader trend remains downward.
Follow top professional traders using Binance Copy Trading
Register on Binance to receive a 10 USDT bonus


