 438
438
 15
15
[11/24/2025] XRP Price Volatility Analysis: Multi-Timeframe Breakdown (1H – 12H – 1D) and 10 Probability Scenarios for the Next 24 Hours

Introduction
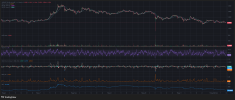
XRP continues to attract strong market attention thanks to its high liquidity, rapid volatility cycles, and consistent participation from both short-term and long-term traders. Based on the chart data you provided, this article delivers a comprehensive, SEO-optimized analysis of XRP's price structure across three key timeframes - 1 hour, 12 hours, and 1 day - along with a detailed breakdown of market indicators such as RSI, MACD, BBW, and OBV.
At the end of the article, you'll also find 10 statistically estimated price-movement scenarios for the next 24 hours, formatted in the required table structure.
1-Hour Timeframe Analysis (1H)
1. Price Structure
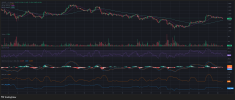
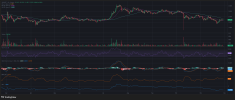
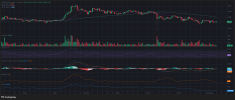
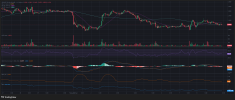
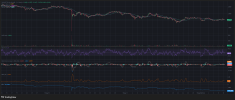
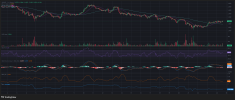
On the 1H chart, XRP is consolidating within the 2.06 – 2.08 USD range. This narrow range signals that the market is currently indecisive, with both buyers and sellers waiting for a catalyst.
2. Rsi (14)
RSI at~56 indicates a neutral state.
This means the market is neither overheated nor oversold, a common sign of pre-breakout compression.
3. Macd
MACD on the 1H timeframe is almost flat, showing very low momentum. This aligns with the current consolidation phase.
4. BBW (Bollinger Band Width)
Low BBW suggests that volatility is tightening. Historically, this pattern precedes a strong move in either direction.
5. Obv
OBV trending sideways reflects a lack of strong inflows or outflows.
This confirms the absence of whale-driven directional pressure.
1H Summary
The 1-hour chart shows accumulation and volatility compression, often a precursor to a breakout within the next 24 hours.
12-Hour Timeframe Analysis (12H)
1. Trend Structure
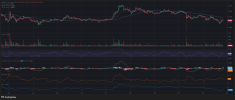
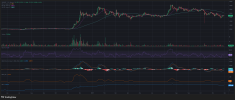
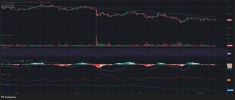
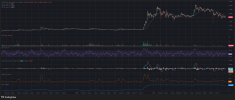
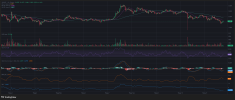
XRP remains in a mid-term correction phase after its previous rally.
MA25 remains below MA99 - a typical short-term downtrend signal.
2. Rsi
RSI around 45–46 continues to reflect weakness but not capitulation.
3. Macd
Although MACD remains negative, it is slowly flattening, indicating that selling pressure is easing.
4. Volume
Volume on the 12H chart is significantly lower than during the previous bullish cycle.
This suggests that the market is stabilizing but not yet trending.
12H Summary
The 12-hour timeframe points to a cooling-down phase with diminishing selling pressure but no confirmed strong bullish reversal.
1-Day Timeframe Analysis (1D)
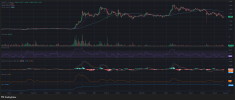
1. Trend Overview
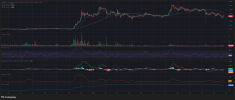
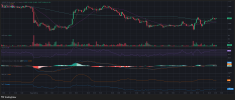
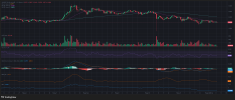
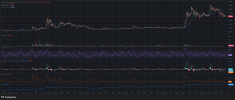
On the daily chart, XRP shows a broader correction from recent highs near 3.5 USD.
MA7 < MA25 < MA99 confirms a sustained downtrend structure.
2. Rsi
RSI at~40 shows that XRP is approaching deeper value zones but has not yet reached oversold levels.
3. Macd
MACD remains bearish with consecutive negative histogram bars.
However, the downward slope is slowing, indicating potential early stabilization.
4. Volume
Daily volume continues to decline - a typical characteristic of a market preparing for accumulation.
1D Summary
The daily chart suggests that XRP is in a macro consolidation phase, absorbing previous selling pressure and potentially preparing for a medium-term trend shift.
10 Price-Movement Scenarios for the Next 24 Hours
| Scenario | Description & Analysis | Probability |
|---|---|---|
| 1. Sideways continuation | Price holds around 2.08 USD as momentum remains weak and indicators neutral. | 35% |
| 2. Mild upside breakout | Price pushes above 2.12–2.15 USD supported by short-term liquidity. | 20% |
| 3. Drop to lower support | If 2.00 USD breaks, price may fall toward 1.95 USD. | 15% |
| 4. Sharp upward rally | Triggered by positive fundamental or whale flows, price targets~2.30 USD. | 8% |
| 5. Sharp downward move | Negative news or large sell orders could push XRP down to~1.80 USD. | 7% |
| 6. Bull trap | Price briefly breaks above 2.15 but fails, reversing quickly. | 6% |
| 7. Bear trap | Price dips under 2.00 USD then aggressively rebounds to 2.05–2.10 USD. | 5% |
| 8. Low-volatility compression | BBW continues tightening, price fluctuates only ±0.03 USD. | 3% |
| 9. Whale-driven volume spike | Sudden spike up or down due to algorithmic or whale activity. | 1% |
| 10. Strong divergence event | Multi-indicator divergence causes a surprising directional breakout. | 0.5% |
Conclusion
Across all timeframes, XRP is currently in a compressed volatility phase, with the 1-hour chart being the closest to signaling an impending breakout. The 12-hour chart reflects diminishing selling pressure, while the daily chart highlights a larger consolidation structure.
Traders should monitor the 2.00 – 2.15 USD zone, as it will likely determine whether XRP breaks upward or downward in the next 24 hours.
Follow top traders using Binance Copy Trading
Register on Binance and receive a 10 USDT bonus


