- BHT
- 15
 236
236
 0
0
[11/24/2025] BNB Price Volatility Report: Full Market Analysis, Multi-Timeframe Outlook, and 10 Potential Scenarios for the Next 24 Hours
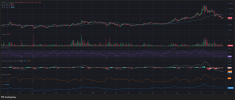
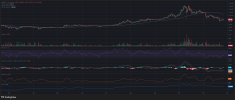
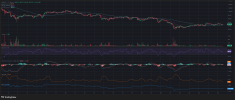
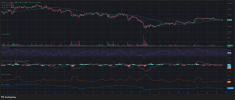
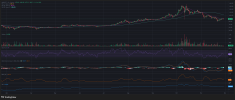
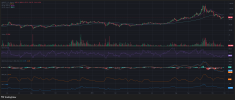
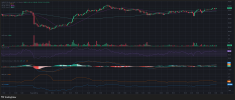
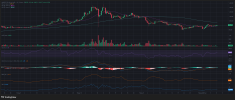
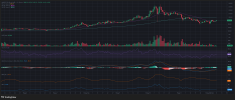
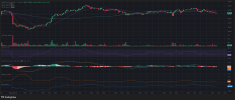
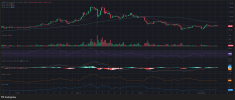
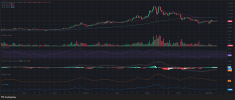
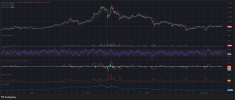
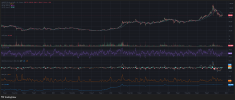
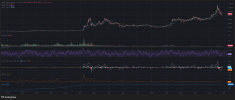
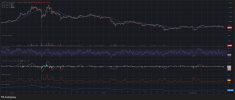
BNB remains one of the most influential assets in the crypto market thanks to its direct connection with the Binance ecosystem. In recent weeks, BNB has shown noticeable volatility as it retraces from its major peak near 1, 300 USD and stabilizes around the 830–850 USD range. The charts you provided for the 1-hour, 12-hour, and 1-day timeframes offer valuable insight into the current market structure, revealing a mix of bearish pressure, weakening momentum, and potential setups for short-term rebounds.
This article provides a comprehensive technical breakdown of BNB's latest price action, analyzes all three timeframes in detail, and presents 10 statistically weighted scenarios for the next 24 hours.

1. Overview of BNB's Current Market Structure
BNB is currently in a corrective phase following a long, sustained uptrend. As profit-taking increases and buyers show hesitation, multiple indicators reflect an overall weakening trend.
Repeated signals across all timeframes include:
Primary trend: Downtrend
Momentum: Weakening
Volume: Insufficient for a trend reversal
Trader sentiment: Cautious and indecisive
Pattern behavior: Compression zones forming, indicating upcoming volatility
Although the broader trend is still bearish, short-term volatility may create windows for temporary rebounds, especially as some indicators approach oversold levels.
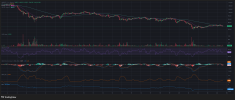
2.1-Hour Chart Analysis (1H)
The 1H chart reflects short-term market dynamics and immediate trader psychology.
Trend
Price trades below both the 50-period and 99-period moving averages.
Market remains in a controlled downtrend with occasional sideways consolidations.
Rsi (1h)
Fluctuating around 45–50.
Neutral momentum, indicating neither overbought nor oversold conditions.
Macd (1h)
Positioned below the zero line.
Weak histogram bars imply lack of strong bullish momentum.
Bollinger Bands (1H)
Noticeable contraction, signaling a potential volatility expansion soon.
Assessment
The 1H setup is leaning toward a near-term breakout, but its direction is uncertain. The market is compressing and waiting for a catalyst.
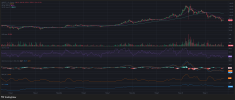
3.12-Hour Chart Analysis (12H)
The 12H timeframe helps identify intermediate trends and broader market flows.
Trend
Price has broken below the MA25, MA50, and MA99.
Indicates a clear shift to medium-term bearish movement.
Rsi (12h)
Around 34, entering mild oversold territory.
Suggests sellers are strong but may be losing intensity.
Macd (12h)
Deeply below the zero line.
Momentum remains bearish, though gradually flattening.
Volume
No major spikes; buyer participation remains weak.
Assessment
The 12H chart shows sustained downward pressure but hints at potential relief bounces if sellers slow down.
4.1-Day Chart Analysis (1D)
The daily chart offers a long-term perspective and reveals the dominant direction.
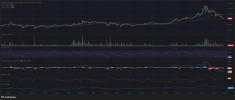
Trend
Price has broken below all major moving averages.
Market has transitioned into a significant corrective phase.
Rsi (1d)
Around 30.9, close to oversold.
Historically indicates increased probability of a short-term rebound.
Macd (1d)
Strong bearish crossover with growing negative histogram bars.
Downward momentum still in control.
Bollinger Bands (1D)
Bands are widening, forecasting continued high volatility.
Volume
Large earlier distribution candles suggest strong sell-off phases.
Assessment
The daily timeframe confirms the broader downtrend but signals that BNB may be approaching a region where short-term relief rallies can occur.
5. Ten Possible 24-Hour BNB Price Scenarios (with Probabilities)
| Scenario | Description & Analysis | Probability |
|---|---|---|
| 1. Mild continuation of the downtrend | Price remains within the 830–850 USD region. RSI neutral, MACD weak, and no strong breakout signals. | 30% |
| 2. Gradual decline to nearby support | If sellers maintain control, price may retest the 820–830 USD region. Weak OBV suggests mediocre buying pressure. | 20% |
| 3. Strong breakdown | A break below 820 USD could drop the price to 780–800 USD if volume intensifies. | 10% |
| 4. Technical rebound to near resistance | RSI signals oversold conditions; price could move to 860–880 USD on short-term buyers stepping in. | 15% |
| 5. Sharp bullish rally | Positive market news or strong demand could push BNB beyond 900 USD, though current momentum is weak. | 5% |
| 6. Tight sideways consolidation | Price fluctuates mildly within 835–850 USD, preparing for a bigger move. | 10% |
| 7. Sudden sell-off from negative news | Regulatory or ecosystem-related events could send BNB sharply below 800 USD. | 3% |
| 8. Pump-and-dump move | Quick surge to 880–900 USD followed by accelerated selling bringing price back to 850 USD. | 4% |
| 9. High-volatility whipsaw | Thin liquidity or sudden volatility may cause large swings between 820–880 USD. | 3% |
| 10. Event-driven surge or decline | A Binance product announcement or structural ecosystem update could trigger large directional movement. | 0.5% |
6. Overall 24-Hour Outlook for BNB
After reviewing all timeframes, indicators show that:
The primary trend remains bearish, especially in the 12H and 1D charts.
RSI values across timeframes suggest price could be entering a potential stabilization phase.
Bollinger Band behavior indicates a high probability of volatility expansion soon.
The highest-probability outcome for the next 24 hours is sideways-to-mild-downtrend behavior within 830–850 USD.
Key levels to monitor:
Support: 820–830 USD
Secondary support: 780–800 USD
Resistance: 860–880 USD
Critical resistance: 900 USD
Short-term rebounds are possible, but traders should remain cautious given the broader bearish structure.
7. Practical Notes for Readers (Not Financial Advice)
Focus on risk management in bearish or uncertain markets.
Avoid emotional trading or catching falling knives.
Monitor how price reacts around key support and resistance zones.
Use timeframes consistently to ensure alignment with trading strategy.


