 439
439
 15
15
[11/24/2025] Comprehensive Analysis of BTC Price Volatility: 1-Hour, 12-Hour, and 1-Day Timeframes with 10 Possible Scenarios for the Next 24 Hours
Bitcoin (BTC) continues to exhibit significant volatility across multiple timeframes, driven by weakening momentum, expanding volatility bands, and shifts in market liquidity. In this in-depth analysis, we break down BTC's behavior through the 1-hour, 12-hour, and 1-day charts while highlighting key technical indicators such as RSI, MACD, MA clusters, volume flow, and OBV. At the end of the article, you'll find a probability-weighted table of 10 potential BTC scenarios in the next 24 hours.

This article aims to help readers better understand near-term BTC volatility and market structure changes.
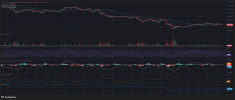
1. BTC Analysis on the 1-Hour Chart
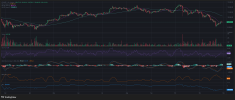
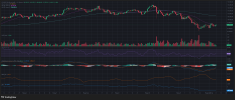
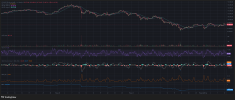
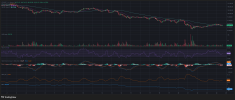
On the 1-hour timeframe, BTC remains in a clear short-term downtrend characterized by consistent lower highs and lower lows.
Key Observations
Moving Averages (MA 25 & MA 99)
MA 25 is positioned below MA 99, confirming a bearish short-term structure.
The gap between the two moving averages remains wide, signaling a persistent downtrend without early signs of reversal.
Rsi (14)
RSI is hovering near 49, indicating neutral momentum.
The indicator has exited oversold territory, suggesting the recent bounce is a weak technical rebound rather than a strong reversal.
Macd
MACD remains below both the signal line and the zero line.
Although histogram bars are gradually shrinking, they do not yet indicate a bullish crossover.
Volume Profile
No significant spike in volume during recovery candles.
Low-volume rebounds typically reflect a lack of buyer conviction.
1-Hour Chart Summary
BTC is showing mild recovery but remains structurally bearish. A decisive break above 87, 000–88, 000 USD on strong volume would shift momentum. However, a breakdown below 84, 000 USD could trigger fresh sell pressure.
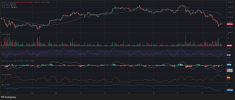
2. BTC Analysis on the 12-Hour Chart
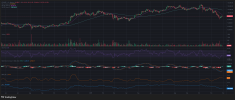
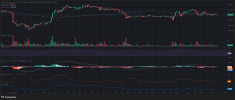
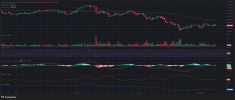
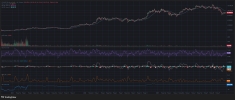
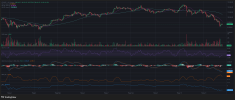
The 12-hour chart offers a medium-term perspective, and the market remains biased toward a downtrend.
Key Technical Signals
Moving Averages (MA 25 & MA 99)
MA 25 has crossed below MA 99, signaling a breakdown of the medium-term bullish structure.
This often precedes multi-session declines unless buyers return with strong volume.
Rsi (14)
RSI around 35 indicates increased bearish pressure.
The level is close to oversold territory but not low enough to confirm a reversal.
Macd
MACD continues to descend sharply.
The wide distance between MACD and the signal line indicates ongoing bearish acceleration.
Volume Behavior
Selling volume increases during down legs, reinforcing the bearish momentum.
Bollinger Band Width (BBW)
BBW expansion indicates growing volatility, suggesting BTC may experience strong moves in the short term.
12-Hour Chart Summary
BTC's medium-term structure remains bearish. The price sits near a critical demand zone at 84, 000–85, 000 USD. Strong buy pressure is required to stabilize the chart. Otherwise, BTC may continue trending downward.
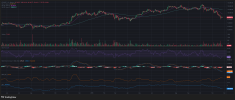
3. BTC Analysis on the 1-Day Chart
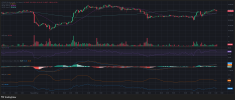
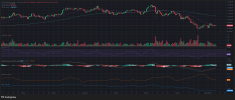
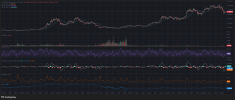
The 1-day timeframe offers the clearest view of BTC's macro short-term trend. BTC shows signs of being oversold while still in an intact downtrend.
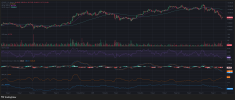
Key Technical Highlights
Moving Averages (MA 7 – MA 25 – MA 99)
MA 7 is below MA 25.
Price is trading below all major MAs (7, 25, and 99).
→ Clear bearish alignment.
Rsi (14)
RSI~28 indicates oversold conditions.
Historically, BTC often sees at least a short-term rebound when RSI drops below 30.
Macd
MACD is deeply negative, though histogram bars are narrowing.
This often signals slowing bearish pressure but not a confirmed reversal.
OBV (On-Balance Volume)
OBV continues to trend downward, suggesting sustained selling pressure.
No signs of accumulation from large buyers.
Volume Activity
Higher volume on selling candles confirms real selling interest.
1-Day Chart Summary
BTC is in a major support area and heavily oversold, but without strong inflows, the trend remains bearish. Sustainable reversal requires BTC to reclaim 90, 000 USD with volume expansion.
4. Ten BTC Price Scenarios for the Next 24 Hours
| Scenario | Description & Analysis | Probability |
|---|---|---|
| Mild rebound / technical recovery | Bounce from 85k–86k driven by oversold RSI and narrowing MACD histogram. | 25% |
| Tight sideways movement | BTC consolidates in the 84k–88k range as volatility stabilizes temporarily. | 20% |
| Strong upward breakout | Surge in buying activity pushes BTC above 88k–90k. | 15% |
| Continued downward trend | MACD, MAs, and OBV show bearish continuation toward 82k. | 15% |
| Stop-hunt dip | Brief drop below 85k before recovering quickly. | 10% |
| High volatility swings | ±5% movement due to macro news or expanded BBW. | 7% |
| Fake bearish breakout | Minor dip followed by a weak bounce, then further decline. | 5% |
| Low volatility range | Tight ±1–2% movement as markets await catalysts. | 2% |
| Strong reversal uptrend | Bullish divergence + strong inflow triggers sharp recovery. | 1% |
| Sharp unexpected crash | Major negative news drives BTC down to 80k or lower. | 0.5% |
Conclusion
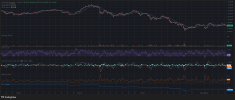
Across the 1-hour, 12-hour, and 1-day charts, BTC generally remains in a bearish phase with signs of oversold conditions. While short-term rebounds may occur, the broader trend remains weak unless BTC recaptures higher price levels with convincing volume. Traders should closely monitor the 84, 000–90, 000 USD zone, as price action here will likely dictate the next directional move.
Copy-trade top experts on Binance Copy Trading
Register on Binance and receive a 10 USDT bonus
Last edited:


