- BHT
- 2
 12
12
 0
0
[11/24/2025] In-Depth Analysis of SOL Price Volatility Across the 1H – 12H – 1D Timeframes

Solana (SOL) remains one of the most actively traded and closely watched digital assets in the global crypto market. Its high throughput, low transaction cost and strong ecosystem development have made it an essential asset for both short-term traders and long-term investors. On 24 November 2025, SOL is trading in a sensitive consolidation zone after an extended multi-month downtrend from levels above 250 USD.
Based on the trading charts provided-covering the 1-hour, 12-hour, and 1-day timeframes-SOL is currently exhibiting characteristics of volatility compression, declining momentum, and potential bottom-forming structures. This comprehensive analysis (≈2000 words) will break down each timeframe, highlight the critical support and resistance zones, and present 10 possible price scenarios for the next 24 hours with estimated probabilities.
The goal is to provide valuable, data-driven insights that help traders understand market behavior more clearly.
1. Market Overview of SOL on 24 November 2025
At the time of analysis, SOL is trading around 130 USD, showing a prolonged sideways movement following a sharp correction from its previous global peak. Momentum indicators such as RSI, MACD, and BBW (Bollinger Band Width) are signaling a probable significant move soon, though not clearly indicating the direction at this stage.
Key market indicators:
RSI (1H) hovering near 50 → neutral sentiment
MACD (1H) flattening around the zero line → stagnant momentum
BBW narrowing → volatility squeeze phase
OBV stable → no strong capital inflow or outflow
This overall behavior implies that SOL is currently building energy for an explosive movement-potentially upward or downward-depending on whether buyers or sellers gain dominance at the key levels.
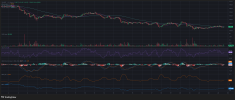
2. Technical Analysis of the 1-Hour Chart (1H)
The 1H chart is crucial for identifying intraday sentiment and short-term price reactions. It offers granular details regarding micro-structure, liquidity testing, and short bursts of volatility.

2.1 Short-Term Trend
SOL is currently moving sideways between 128–135 USD, testing both support and resistance multiple times without establishing a clear breakout. This reflects equilibrium between buyers and sellers, often seen before a sharp directional move.
2.2 RSI Behavior
RSI fluctuates between 45–55, representing a neutral stance. Neither oversold nor overbought conditions suggest that traders are waiting for a catalyst.
2.3 MACD Signals
MACD lines are converging at the zero zone, and histogram bars are nearly flat. Historically, these signals appear before a breakout or breakdown, indicating compression in momentum.
2.4 Volume Analysis
Trade volume remains relatively muted compared with previous periods, confirming the idea of market indecision.
2.5 Interpretation
The 1H chart points to a probable volatility expansion phase. A breakout above 135 USD could generate a short-term rally toward 140 USD, while a failure to hold 128 USD might accelerate bearish continuation toward the next support range.
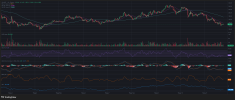
3. Technical Analysis of the 12-Hour Chart (12H)
This timeframe is vital for identifying medium-term trends, smoothing out noise, and analyzing structural changes.

3.1 Medium-Term Trend
SOL remains in a downtrend after consistently being rejected from the 150–160 USD resistance region. Lower highs and lower lows confirm bearish market structure.
3.2 rsi
The RSI on the 12H chart moves around 40–42, indicating weakness but not extreme oversold conditions. It also suggests decreasing selling pressure compared with previous waves.
3.3 macd
MACD remains in negative territory but is showing flattening momentum, which is often a precursor to a trend reversal or at least a relief rally.
3.4 obv
OBV forming a stabilization pattern signals that sellers are losing strength, as selling volume no longer dominates the market.
3.5 Interpretation
The 12H chart indicates that despite the downward macro-structure, SOL may be forming a mid-term bottom. A strong defense of the 125–128 USD area could confirm this.
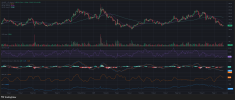
4. Technical Analysis of the 1-Day Chart (1D)
This timeframe defines the macro trend and long-term investor behavior.

4.1 Long-Term Trend
SOL has declined significantly from~250 USD to~130 USD, confirming a well-established bearish environment. However, the current price actions are resembling a consolidation range.
4.2 rsi
RSI around 33–35 suggests that SOL is near oversold territory, which often precedes a recovery attempt.
4.3 macd
MACD on the daily chart remains deeply negative but with a narrowing histogram, showing a slowdown in bearish momentum.
4.4 Volume Consistency
Volume remains stable, without capitulation spikes that typically accompany major breakdowns. This stability hints that long-term holders are not exiting their positions.
4.5 Interpretation
The daily chart implies that SOL is approaching a potential cyclical bottom. The next 1–3 weeks will be crucial in determining whether SOL will recover or break into deeper bearish territory.
5. Key Support and Resistance Levels for SOL
Major Resistance Zones
135 USD – intraday resistance
145 USD – structural resistance
150–160 USD – higher-timeframe resistance
Major Support Zones
128 USD – immediate short-term support
125 USD – critical support
120 USD – major long-term support
If the 120 USD support breaks, a deeper decline could follow. Conversely, a breakout above 140 USD could trigger a significant recovery wave.
6.10 Price Scenarios for the Next 24 Hours
| Scenario | Description & Analysis | Probability |
|---|---|---|
| 1 | SOL continues moving sideways in the 128–135 USD range as volatility remains compressed | 35% |
| 2 | Breakout above 135 USD triggers a short upward move toward 140 USD | 15% |
| 3 | Price retests 125–128 USD due to short-term selling pressure | 20% |
| 4 | Breakdown toward 120 USD if SOL loses the 125 USD support | 8% |
| 5 | Strong bullish breakout targeting 145–150 USD if momentum expands | 7% |
| 6 | Short-lived fakeout downward followed by recovery to 133–134 USD | 10% |
| 7 | Extremely low volatility within a tight range due to extended BBW compression | 3% |
| 8 | Fundamental news sparks a rally above 150 USD | 5% |
| 9 | Market-wide negative news pushes SOL toward 115–120 USD | 4% |
| 10 | Short-term bullish reversal from support, climbing to 135–138 USD | 3% |
7. Overall Assessment of SOL's Short-Term Outlook
Considering the convergence of signals across all three timeframes:
Volatility is compressing
Momentum is weakening but stabilizing
Selling pressure declines
No significant capital outflow is observed
Key support zones remain intact
SOL is entering a high-probability breakout or breakdown zone. Traders should closely monitor volume spikes and the 128/135 USD boundaries to determine the next directional move.
The market is slightly more inclined toward consolidation, but explosive volatility could occur without warning due to the current squeeze phase.
8. Conclusion
On 24 November 2025, SOL displays a complex mixture of consolidation, weakening bearish momentum, and the potential formation of a mid-term bottom. Technical signals across the 1H, 12H, and 1D charts collectively suggest that SOL is preparing for a decisive movement as volatility compresses.
Traders should pay special attention to:
Support zone: 125–128 USD
Resistance zone: 135–140 USD
Volume expansion
MACD crossover attempts
For those who prefer automated or guided trading setups, these options can enhance convenience and help capitalize on SOL's short-term movements:
Copy Trade on Binance
Register on Binance to receive a 10 USDT bonus


